I predict the forecasters will be wrong
Posted: January 21, 2016 Filed under: Economics, Finance, Oil, Statistics | Tags: finance, forecasting, Oil, wall street Leave a commentRecently, the price of a barrel of West Texas Intermediate (WTI) Crude Oil dropped to below $30. Just 18 months ago, the price was over $100.
Here is the price of oil over the last 5 years:
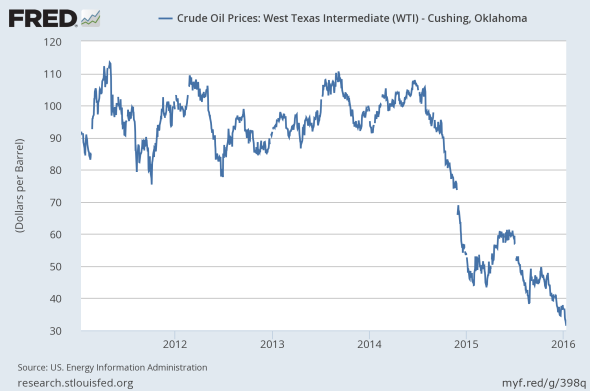
It’s worth thinking about whether anyone saw this coming.
Earlier last year, after the initial and huge drop in the price of oil to below $50, there was a very interesting article in Bloomberg about how wrong most forecasters were in their predictions on oil. They extrapolate from the present in ways that presume a certain stability in the world that does not exist. In the Bloomberg article, the actual price of oil was half that of the lowest Wall Street estimate.
How have they been doing since? Of the analysts surveyed, the lowest had oil somewhere around $50, a full $20 higher than where it is now. And the median estimate was closer to $70.
In April, having observed the huge declines, the professional forecaster, despite some useful knowledge of individual energy companies and OPEC, did not fully appreciate that China’s economic growth might slow, resulting in substantially less oil demanded; that a deal with Iran might come to be, resulting in more oil on the world markets; that Saudi Arabia would refuse to cut output and instead prefer to take market share, further increasing the supply of oil.
This is not unique to oil, as you might guess. At the beginning of 2015, experts had also expected continued gains in the stock market on the order of 8%, similar to what had occurred in 2014. Instead, the S&P 500 dropped 0.7%.
The world is a complex place, and it is difficult to admit that we cannot know the ways in which things will turn. But Wall Street experts continue to believe that they can predict the world’s events. It seems even the most pessimistic of the professional analysts could not have foreseen the size of the drop in oil. Similarly, following the Great Recession and the tremendous stock market declines, most could not foresee the massive stock market rally.
Over a number of years, researchers at Duke collected over 11,000 surveys in which CFOs of large corporations were asked to forecast the S&P 500 index’s return for the following year. Not only did their forecasts (or point estimates) have zero predictive value, but the CFOs also provided 80% confidence intervals. Anything outside of this area would be deemed a surprise (or an outlier). If they had constructed accurate confidence intervals repeatedly, the actual returns would occur outside of their intervals roughly 20% of the time. In truth, this occurred 67% of the time.
At the start of a new year, I find it useful to remind myself to discount experts’ advice, especially when it is provided on the basis of authority alone: try to assess the argument rather than the self-confidence.
Future Basketball Statistics
Posted: March 12, 2013 Filed under: Basketball, Statistics, Technology Leave a commentI have no doubt that NBA teams probably have sophisticated (and proprietary) databases and technically-savvy analysts looking at all kinds of basketball data to assess strengths and weaknesses of teams and individual players.
But as an outsider looking in, I was thinking about what areas of data analysis in basketball seem most promising for the future, given that we are now in a “big data” world.
First, basketball is really hard to analyze because there are countless variables interacting with each other all the time. In baseball, you can analyze a pitcher and a batter and ignore everyone else, basically, without losing too much information. In basketball, there are always people active on the court beyond just the shooter. There are help defenders, there’s the guy that fed the shooter the pass, there’s the guy that fed the guy who fed the guy the pass, there’s the guy that set the screen, and there’s the guy on the opposing team in the paint who may be deterring a drive that was never attempted. So it seems like focusing on problems of interacting variables is something that should be given more thought than it has been given thus far.
Second, basketball is spatial, so it would be interesting to do more in this area. Already TV networks visually show shot selections for various players, but I don’t get the sense that it has gotten much deeper than that.
Third, as I alluded to in a previous post, people look at averages but not so much at the variability of players’ performances. Getting some measure of how consistent players are seems important in correctly assessing value.
Finally, analyzing injury impacts on players in a statistically-rigorous fashion would be interesting, and probably really helpful for teams who are considering signing players who are just coming off injuries. Andrew Bynum is one example of this. A database of ACL-injuries, pre and post-injury, and whether things improved over time, or whether you could predict the quality of a comeback based on the first 10 games, for example, seem like interesting questions to try and answer.
Some questions can be answered as more and better data are collected, but other questions are simply hard to quantify and answer with data. Quality of coaching seems like one area in particular where this holds true.
Kobe Bryant’s Year and Lebron James’s Evolution
Posted: January 5, 2013 Filed under: Basketball, Statistics | Tags: data, kobe bryant, lebron james, nba 1 CommentThis is not a typical post, but I was thinking about basketball the other day and I got kind of interested in a few topics.
This started when I recently saw that Kobe Bryant is averaging over 30 points per game, at the age of 34. This seemed strange to me, and admittedly being somewhat biased against him, I chalked it up to the fact that he was a ball hog. But I wanted to look at the data. I was interested in two items: (1) How has Kobe Bryant’s shooting (at least in the regular season) evolved over time? (2) Has it become more or less variable over time?
Rather than look at all field goal attempts and all field goals made and then simply coming up with a regular season average, I thought it would be better to take field goal percentage from each game and weight each game equally. I also thought it would be interesting to look at the median and the 25th/75th percentiles for each regular season. I see lots of basketball statistics, some of them great, but I don’t see lots of graphing, which is unfortunate as they can be great at conveying information. I used data from http://www.basketball-reference.com/.
First, I plot Kobe Bryant’s median field goal percentage for each regular season from 1998-1999 to 2012-2013 (31 games so far). The green bars give you the 25th and 75th percentile of his shooting. In other words, 50% of the games will fall between the two bars. I do not include Kobe Bryant’s first two seasons, as he was not a starter and had strange minutes/shooting, compared to the rest of his career.

A few things stand out to me. First, his median field goal percentage is very consistent over time, right around 46%. There is of course one exception: the current 2012-2013 season, where Kobe Bryant is shooting 50%. The interquartile range in the current season is on the lower end of his career, but it is consistent. The standard deviation of his field goal percentage is also roughly the same. But his shooting is much better. Kobe Bryant, at age 34, is playing the best season of his career if we are to look at accuracy. For a shooting guard, this is a good (but not perfect) measure to use.
The thought then occurred to me: maybe Kobe Bryant always shoots this well in the first 31 games of a season, and then it drops off. So I produced the same chart looking only at the first 31 games of each season.
 Here the picture is a bit more nuanced. This season is still impressive in a few ways. He has shot this well for the first 31 games a few times before, but he has been much more consistent if we pay attention to the inter-quartile range. If we put weight on both the field goal percentage and the consistency, then this is still the best season of Kobe Bryant’s career. Of course, things could change dramatically over the course of an 82-game season, and none of this takes into account the many other factors that might be having an influence here. In any event, I’ve misjudged Kobe Bryant, at least this season.
Comparing Kobe Bryant and Lebron James maybe doesn’t make a lot of sense. Different players, different roles on the court, doing different things for their teams. But superstars are superstars.
 What we see is pretty consistent improvement in shooting percentage over the course of Lebron’s 9 seasons. Recall that this area around the median is where 50% of his games have fallen into. What’s most remarkable is that this region, which I’m using as a measure of consistency, has narrowed considerably from the 2011-2012 season. Prior to the current season, the interquartile range (IQR, the top green bar minus the bottom gren bar) ranged from about 12 to 16 percentage points. In the first 31 games of the 2012-2013 season, this has dropped to about 9 percentage points.
Again, to check to see if this is not a feature of the first 31 games of every season, I look at only the first 31 games of each season.
 We again see shooting broadly similar to the previous season. But there’s a level of consistency that is really impressive.

There are many other things one has to look at: turnovers, assists, and of course wins and playoff outcomes. I’m aware there are many complicated statistical measures that do a good job at measuring the total impact of a player, but I just wanted to look at some basic questions on my own. I hope to explore more basketball data soon.
